Smartphones are ever-present as we move through our day, and are rarely out-of-reach, so brands and advertisements persistently push phone-based interactions to deepen that customer connection: “text this number, scan this QR code, download our app,” etc. This poses a burning question:
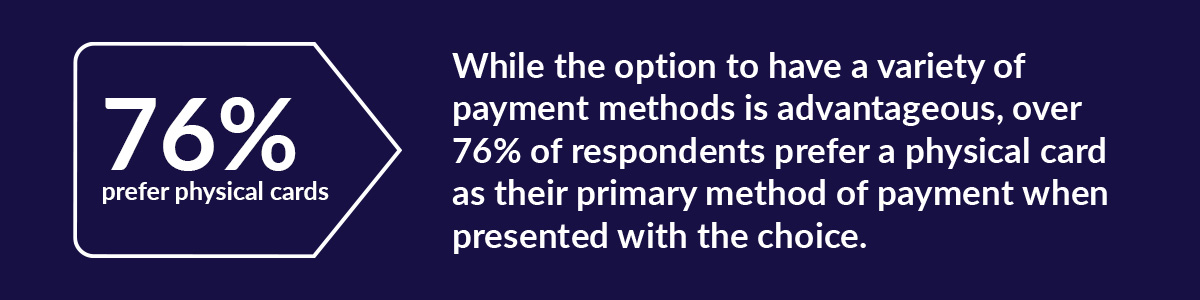
Working with an independent research firm, CPI gathered consumer data that indicates that payment options from a smartphone are appreciated, but payment cards are dominant. Over 76% of the respondents to this survey* indicated that physical cards are their primary method of payment and what’s more, 62% prefer physical cards over all other options.
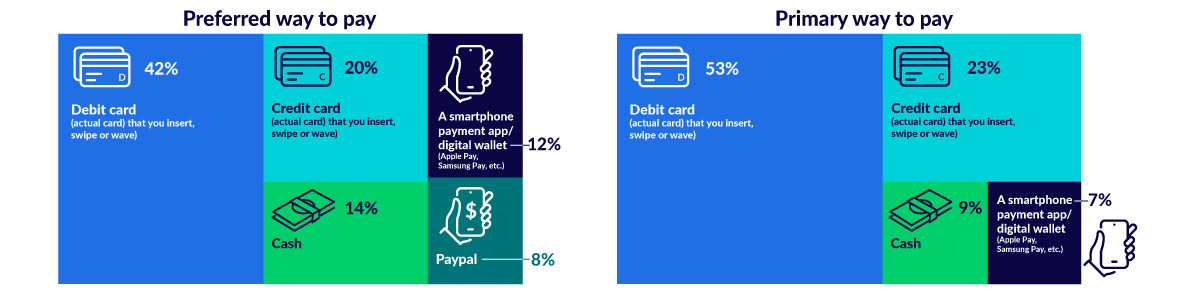
Preferred way to pay, 42% physical debit card, 20% physical credit card, 14% cash, 12% smartphone payment app or digital wallet, 8% PayPal. Primary way to pay, 53% physical debit card, 23% credit card, 9% cash, 7% smartphone payment app or digital wallet.
Media-Influenced Perception
Widespread media coverage around digital payment solutions no doubt contributes to a general perception that consumers are broadly changing their purchasing habits to utilize non-traditional means of payment (smart tech, payment platforms, etc.). However, the survey data CPI has compiled does not support this claim.
The perception that consumers are leaving their houses with nothing more than just their smartphone/smartwatch appears to be a modern myth. As a matter of fact, according to this 2022 survey conducted by an independent research firm, 79% of debit and 52% of credit card users “totally agreed” that they bring their physical card with them wherever they go, and what’s more, they expressed that they were more likely to use their card than a smartphone/smartwatch.
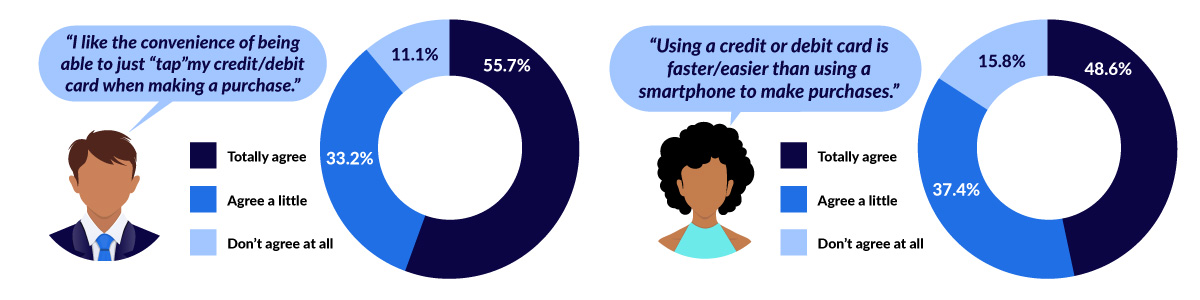
Why might consumers prefer making purchases with physical cards? The convenience of contactless cards resonates – with a full 56% who “totally agree” that “I like the convenience of being able to just tap my credit/debit card” and another 33% responding that they agree “a little”. People also agree that using a credit or debit card is “faster/easier” than using a smartphone to make purchases. 47% totally agreed and another 37% agreed a little.
"I like the convenience of being able to just "tap" my credit when making a purchase" 55.7% of survey respondents agree, 33.2% agree a little, and 11.1% don't agree at all. "Using a credit or debit card is faster/easier than using a smartphone to make purchases", 48.6% of survey respondents totally agree, 37.4% agree a little, and 15.8% don't agree at all.
Generational Assumptions
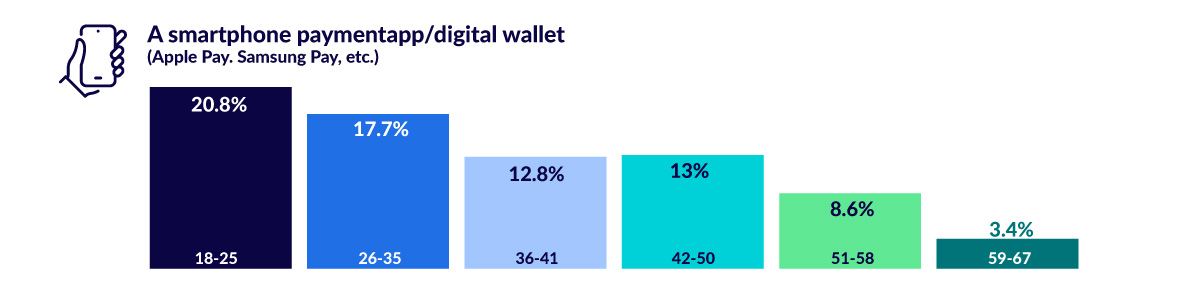
Perpetuating some perceptions about smartphone payments are assumptions about Generation Z in the marketplace. Of the demographics that participated in the study, respondents ages 18-25, and even 26-34 were the most likely (about 21%) to say that making purchases and payments with a smartphone was their preferred way to pay.
Usage of a smartphone payment app/digital wallet by generational demographic. 20.8% are 18-25 yrs old, 17.7% are 26-35, 12.8% are 36-41, 13% are 42-50, 8.6% are 51-58, 3.4% are 59-67.
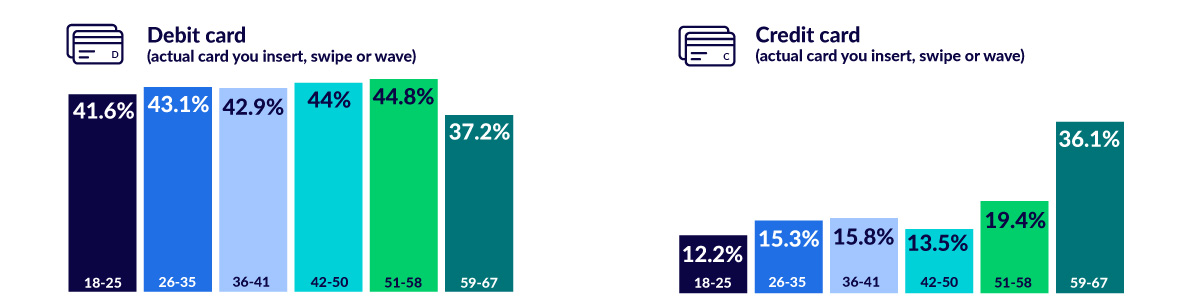
However more than twice the number of 18-25-year-olds preferred making purchases and payments with a debit card and that same demographic still indicated that overall, they prefer physical cards. For 26-35-year-olds, the preference for debit cards was 43% vs. 18% for smartphones.
Preferred usage of a physical Debit Card by generational demographic, 41.6% are 18-25 yrs old, 43.1% are 26-35, 42.9% are 36-41, 44% are 42-50, 44.8% are 51-58, 37.2% are 59-67. Preferred usage of a physical Credit Card by generational demographic, 12.2% are 18-25, 15.3% are 26-35, 15.8% are 36-41, 13.5% are 42-50, 19.4% are 51-58, 36.1% are 59-67.
People Appreciate Choices. Give them what they want.
Regardless of how the data from this survey is segmented ̶ by the form of payment or by use-type (swipe, insert, tap) ̶ one variable that all respondents strongly acknowledge is the diverse solution options. Having the choice of which option to use are the preferred scenario of the modern marketplace.
If you’re interested in learning more about how CPI can help you expand your card portfolio with debit, credit, and prepaid card options, give us a call. We are also able to help financial institutions that are interested in adding smartphone payment options for their accountholders through our Digital Card and Push Provisioning programs. Contact us here.
*Online survey of 2100 credit and debit card account users aged 18-65, conducted November 3-10, 2022
We use cookies on our website to give you the most relevant experience by remembering your preferences and repeat visits. By clicking “Accept”, you consent to the use of ALL the cookies.